On Becoming a Data-Driven Organization
Most companies today have “become more data-driven” somewhere in their strategic plans. This is no surprise given the abundance of data and analytics resources available today.
As Microsoft CEO Satya Nadella recently put it:
“We believe that with the right tools, insights can come from anyone, anywhere, at any time. When that happens, organizations develop what we describe as a ‘data culture.’
The point: Big Data is here now and you can start using it today…if you can get the culture right. The problem: Quotes like this describe the potential of creating a data culture, but they don’t tell you how to create one.
Now what?
I’ve held senior management positions as both a data-provider and a data-analyzer in three, large global organizations. While in these roles I have gathered some insights on how companies can evolve into high-performing data-driven organizations. And I’ve converted these insights into a 2-Step approach to plot a course for your organization to achieve the goal of being truly data-driven.
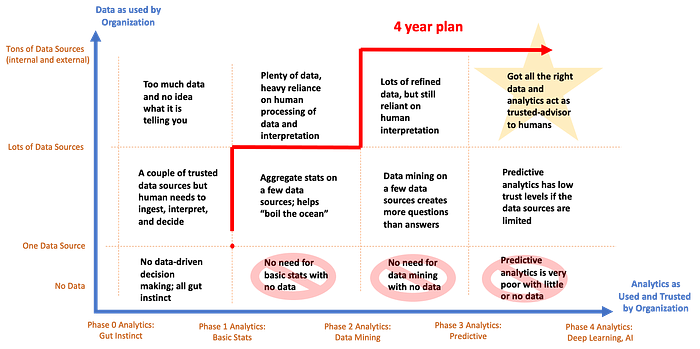
Step 1 is taking an honest assessment of where your organization is today along 2-dimensions on what I call the Data Driven Decision Making Map

The y-axis is an assessment of the number of data sources that are both 1) available to the analytics teams in your organization and 2) trusted by the business units in your organization. Agreement is important. If all the teams in your organization do not agree, it will lead to mis-trust of analytics results developed on this data. These data sources can be from within your organization or from third parties, but it is important to be honest in your assessment: the data sources count must be mutually agreed upon by all teams involved.

The x-axis on the map is an assessment of your organization’s analytics capabilities. But, in this case it is not about quantity but increasing skills. The progression-to-AI is one many organizations want to take today, but it cannot happen overnight if there are no analytics to begin with. Organizations need to learn their way to AI in steps or else the results will not be used business for important decision-making. How often have you seen this scenario: lots of really cool data science models running in a lab but nothing in production. If an organization is starting with no analytics, the first step is to introduce basic statistics and reporting capability. Once business teams are comfortable using and trusting these skills, you can move to data mining. And then on to prediction and general modeling. Getting predictive models into production and used by the business is a big step for an organization because it requires the business to trust that the analytics models are providing good business decision-making. Once prediction is firmly established in your organization, you can introduce AI (e.g., deep learning, machine learning, etc.) which requires the most trust from the business if it is to be used in production. So be honest in the assessment: 1) are the skills in your organization and 2) are those skills being used by the business to make important decisions?

Next, a grid is created that combines data usage with analytics usage. Going across the first row of “No Data” usage, we see that Analytics is not possible and the only viable cell is “gut instinct”. Do you know any areas of your business that operate this way? I personally worked with a local sales team that used this approach because finding reliable and trustworthy data resources was extremely expensive or, in their case, very unreliable. Without affordable and trustworthy data, it is not possible to be data-driven.
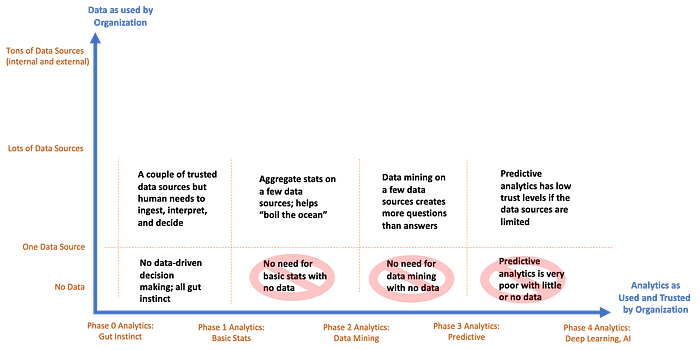
Moving up the data axis to having at least one trusted and usable data source, the opportunity to use analytics becomes possible. However, confidence in the results is often called into question when the number of data sources is small. The world of analytics modeling is competitive one and the easiest way to challenge a model is to simply use a different data source. I have observed the following situation often. A model that is production produces counter-intuitive results resulting in the business questioning it. If the analytics team only used one data source, a very easy work around is for the business to seek another solutions that simply utilizes an alternate data sources. And, as often the case so as not to upset their internal analytics team, they frequently seek help from an external team. While the business team may feel “data-driven” utilizing this approach, this is not true for the whole organization if the internal teams are not in agreement. The Data-Driven Decision Making Map only works if all teams agree to the assessment.
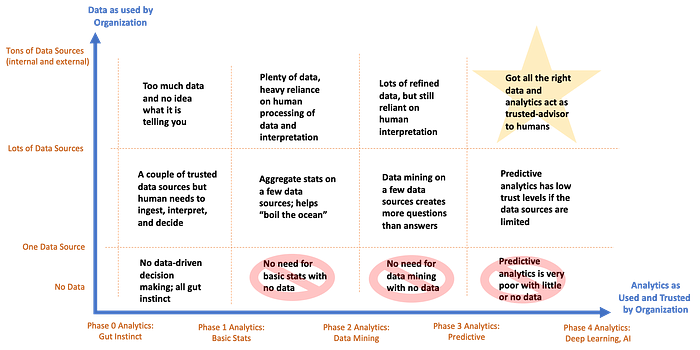
For internal data and analytics teams to be successful at transforming an organization to becoming truly data driven, access-to and usability-of all relevant data sources is required. That does not mean you have to buy every data source in the world, you just need to have done the comparison and have a view-point that the data your organization has access to is the Best-of-the-Best (this should be a primary mission of the Chief Data Office, in my opinion). As a result, analytics and Data Science teams will thrive in this protected environment and will be free to build more advanced and predictive models that will be trusted by the business. Once the proverbial “data rug” has nailed to the floor so it can’t been removed, the business and analytics teams are forced to compare results on the quality of the modeling which is one that can be better solved by the internal analytics team.
Now, how do you move your organization to the top right quadrant? Most CEO’s want to get there now! However, it has been my experience that the progression is stepwise process that should be planned out over several years, especially for large organizations with time baked in for coordination and planning, data purchase and evaluation, analytic assessments and hiring, education and training. And, if your business units rely on production systems, it requires adapting those systems to manifest these analytical models.
Step 2 is about plotting a path to the top right quadrant for your organization.
Below is a map of the step-wise progress a large organization can make in a one-year period. Moving up the data axis is often easier but only if you have an established data team. Given the extremely competitive Data Science and analytics talent market, and the education and adoption of the methods by the business teams makes expanding along the analytics axis a bit more difficult and time consuming. Finally, making a diagonal shift by moving the data and analytics capability at the same time in a one-year period is a stretch goal for an organization and will take a lot of coordination between the data, analytics, and business teams.
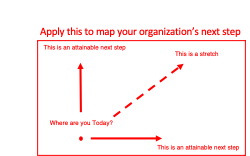
Use this mapping tool in combination the evolution map to determine your organization’s 1-year progress opportunities. Place the red dot of the mapping tool on the bottom corner of the grid where you organization currently is in terms of data and analytics usage. Below, is an example of an organization that uses one data source and basic statistics:
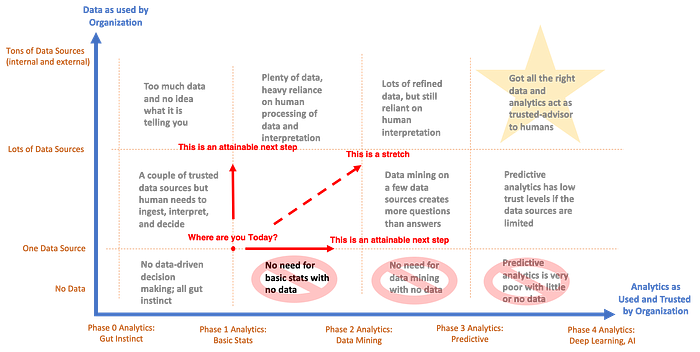
A reasonable “next step” for a large organization with a year of effort is to either expand their number of data sources used by the organization or advance their analytics capability to data mining on their existing sources. A stretch goal for the organization is to apply all the new analytics to all the new data sources. This is a challenge because the data team needs time to evaluate the data, compare it to current sources, and make it available for advanced analytics. In addition, the analytics teams need to hire and introduce new skills and get the production systems to accept these new features.
Using this diagram, a company can determine if they need to invest in data or in analytics resources in a particular year. For large, global organizations, I suggest it is best to stagger these investments over time: invest in data in year 1, invest in analytics in year 2, etc. Below is a plot of what a 4-year plan to move a large organization to use AI in it business decision making.
Becoming data-driven is a lofty goal and can seem simple given there is so much data today plus there are many advanced analytics methods and resources available. While it may be easy to say, it is actually quite difficult to get a large organization to become truly data-driven so that it is has access to as most data that is available and leveraging all the best analytics capabilities to inform their important decision-making. The key is to follow a two-step plan that combines the data and analytics adoption in your organization in a steps and stages. Each step in the process needs to be locked (e.g., adopted and used-in-production) before proceeding to the next to ensure a culture of trust-in-analytics is built up in the organization.